How To Calculate Monthly Recurring Revenue Cohort Analysis in Quickbooks | Arithmix
Learn how to calculate monthly recurring revenue cohort analysis in Quickbooks with our step-by-step guide. Improve your financial analysis skills and make data-driven decisions for your business.

Calculating monthly recurring revenue (MRR) cohort analysis is an essential tool for businesses to understand their revenue streams. It helps businesses track their revenue growth, identify trends, and make informed decisions about their future strategies. MRR cohort analysis is a powerful tool that can help businesses understand how much revenue they can expect to generate each month from their customers. In this article, we will discuss what MRR cohort analysis is, when it is valuable to calculate it, and how to do it.
What Is Monthly Recurring Revenue Cohort Analysis?
Monthly recurring revenue (MRR) is the amount of revenue a business can expect to receive each month from its customers. Cohort analysis is a method of analyzing data by grouping customers into segments based on a shared characteristic, such as the month they signed up for a service. MRR cohort analysis combines these two concepts by analyzing the monthly recurring revenue of each cohort over time.
For example, let's say a business has 100 customers who signed up for their service in January. In February, they gained 50 new customers, and in March, they gained 75 new customers. By analyzing the MRR of each cohort (January, February, and March), the business can see how much revenue they can expect to generate each month from each cohort.
MRR cohort analysis can help businesses identify trends in their revenue growth. For example, if the MRR of a particular cohort is decreasing over time, it may indicate that customers are churning or canceling their subscriptions. On the other hand, if the MRR of a cohort is increasing over time, it may indicate that customers are upgrading their subscriptions or purchasing additional products or services.
When Is It Valuable To Calculate Monthly Recurring Revenue Cohort Analysis?
MRR cohort analysis is valuable for businesses that rely on recurring revenue streams, such as subscription-based services or SaaS (Software as a Service) companies. By analyzing the MRR of each cohort over time, businesses can gain insights into their revenue growth and make informed decisions about their future strategies.
For example, MRR cohort analysis can help businesses identify which customer segments are most valuable and which ones are at risk of churning. It can also help businesses identify which products or services are most popular among their customers and which ones need improvement.
How To Calculate Monthly Recurring Revenue Cohort Analysis
Calculating MRR cohort analysis involves several steps:
- Group customers into cohorts based on a shared characteristic, such as the month they signed up for a service.
- Calculate the MRR of each cohort for each month.
- Plot the MRR of each cohort over time to identify trends.
Calculating MRR can be done using a simple formula:
MRR = Average Revenue Per User (ARPU) x Total Number of Users
For example, if a business has 100 customers who pay $10 per month, their MRR would be:
MRR = $10 x 100 = $1,000
Once the MRR of each cohort has been calculated, it can be plotted on a graph to identify trends. For example, a business may notice that the MRR of a particular cohort is decreasing over time, indicating that customers are churning or canceling their subscriptions.
In conclusion, MRR cohort analysis is a valuable tool for businesses that rely on recurring revenue streams. By analyzing the MRR of each cohort over time, businesses can gain insights into their revenue growth and make informed decisions about their future strategies. Calculating MRR cohort analysis involves grouping customers into cohorts, calculating the MRR of each cohort, and plotting the MRR of each cohort over time.
How Do You Calculate Monthly Recurring Revenue Cohort Analysis in Quickbooks
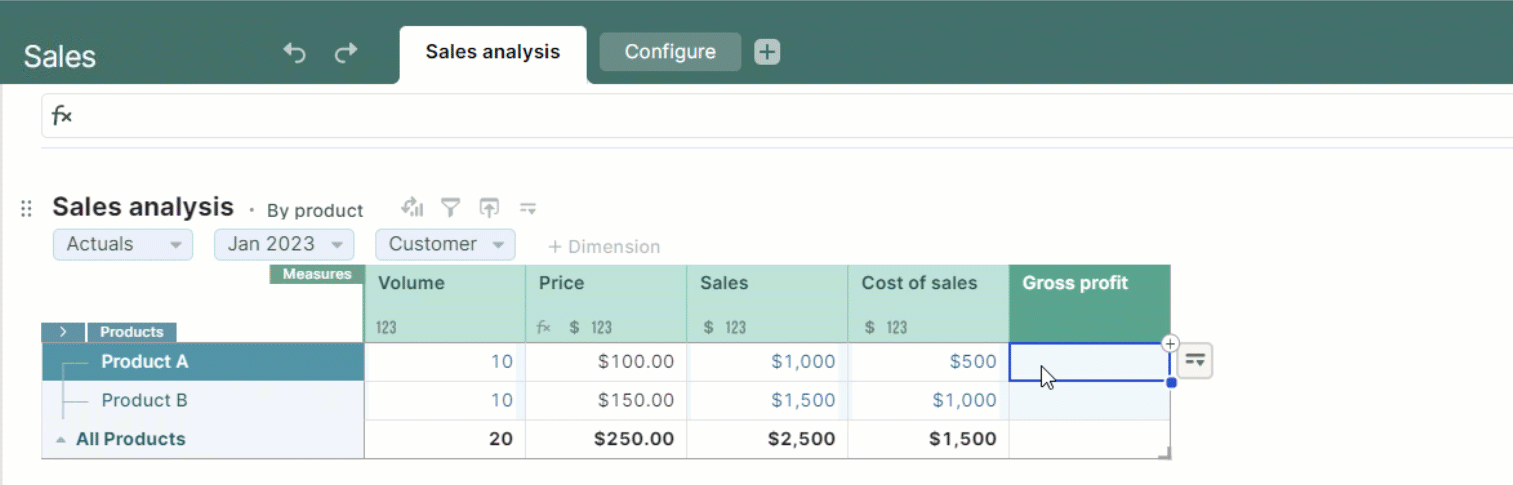
Quickbooks itself isn’t naturally geared towards letting you calculate complex metrics like Monthly Recurring Revenue Cohort Analysis. As an alternative, teams typically use products like Arithmix to import data from Quickbooks and build out dashboards.
What is Arithmix?
Arithmix is the next generation spreadsheet - a collaborative, web-based platform for working with numbers that’s powerful yet easy to use. With Arithmix you can import data from systems like Quickbooks, combine it with data from other systems, and create calculations like Monthly Recurring Revenue Cohort Analysis.
In Arithmix, data is organized into Tables and referenced by name, not by cell location like a spreadsheet, simplifying calculation creation. Data and calculations can be shared with others and re-used like building blocks, vastly streamlining analysis, model building, and reporting in a highly scalable and easy to maintain platform. Data can be edited, categorized (by dimensions) and freely pivoted. Calculations are automatically copied across a dimension - eliminating copy and paste of formulas.
Arithmix is fully collaborative, giving your entire team access to your numbers and the ability to work together seamlessly.
Calculating Monthly Recurring Revenue Cohort Analysis in Arithmix
Calculating metrics like Monthly Recurring Revenue Cohort Analysis is simple in Arithmix. Once you've created your free account, you’ll be able to import your Quickbooks data, and use it to create natural language formulas for metrics like Monthly Recurring Revenue Cohort Analysis.
Arithmix is designed to give you the power to build any calculations you want on top of your Quickbooks data, while also being easy to use and collaborate on. You can share your dashboards with users inside and outside of your organisation, making it easy to empower your whole team.
Use Arithmix free