How To Calculate Pipeline Coverage in Hive | Arithmix
Learn how to calculate pipeline coverage in Hive with our step-by-step guide. Increase your understanding of data processing and analysis with this essential skill for any data professional.

Calculating pipeline coverage is an important metric for any business that wants to understand how effectively they are converting leads into customers. Pipeline coverage is the ratio of the value of deals in the sales pipeline to the sales target for a given period. Essentially, it shows how much potential revenue is in the pipeline compared to the revenue goal for a specific time frame. In this article, we will explore what pipeline coverage is, why it is valuable to calculate, and how to calculate it in Hive.
What Is Pipeline Coverage?
Pipeline coverage is a metric that helps businesses understand how much potential revenue they have in their sales pipeline compared to their revenue goal. It is calculated by dividing the total value of deals in the pipeline by the sales target for a specific period. For example, if a business has $1 million in deals in their pipeline and their sales target for the quarter is $2 million, their pipeline coverage would be 50%.
Pipeline coverage is a valuable metric because it helps businesses understand how much potential revenue they have in their pipeline and how likely they are to hit their revenue targets. It also helps businesses identify areas where they may need to focus their sales efforts to increase pipeline coverage and ultimately drive revenue growth.
When Is It Valuable To Calculate Pipeline Coverage?
Calculating pipeline coverage is valuable for any business that has a sales pipeline and revenue targets. It is particularly valuable for businesses that have long sales cycles or complex sales processes. In these cases, pipeline coverage can help businesses identify potential bottlenecks in their sales process and take action to improve their pipeline coverage.
Pipeline coverage is also valuable for businesses that are looking to grow their revenue quickly. By understanding how much potential revenue they have in their pipeline, businesses can identify areas where they can focus their sales efforts to increase pipeline coverage and ultimately drive revenue growth.
How to Calculate Pipeline Coverage in Hive
Calculating pipeline coverage in Hive is a straightforward process. First, you need to gather data on the value of deals in your sales pipeline and your sales target for a specific period. This data can be gathered from your CRM or sales management system.
Next, you need to calculate the pipeline coverage ratio by dividing the total value of deals in the pipeline by the sales target for the period. This can be done using a simple SQL query in Hive. For example, the following query would calculate pipeline coverage for a given quarter:
SELECT SUM(deal_value) / sales_target AS pipeline_coverageFROM sales_pipelineWHERE quarter = 'Q1';
This query would return the pipeline coverage ratio for Q1 based on the data in the sales_pipeline table.
In conclusion, calculating pipeline coverage is an important metric for any business that wants to understand how effectively they are converting leads into customers. By understanding how much potential revenue they have in their pipeline compared to their revenue targets, businesses can identify areas where they need to focus their sales efforts to increase pipeline coverage and ultimately drive revenue growth. Calculating pipeline coverage in Hive is a straightforward process that can be done using a simple SQL query.
How Do You Calculate Pipeline Coverage in Hive
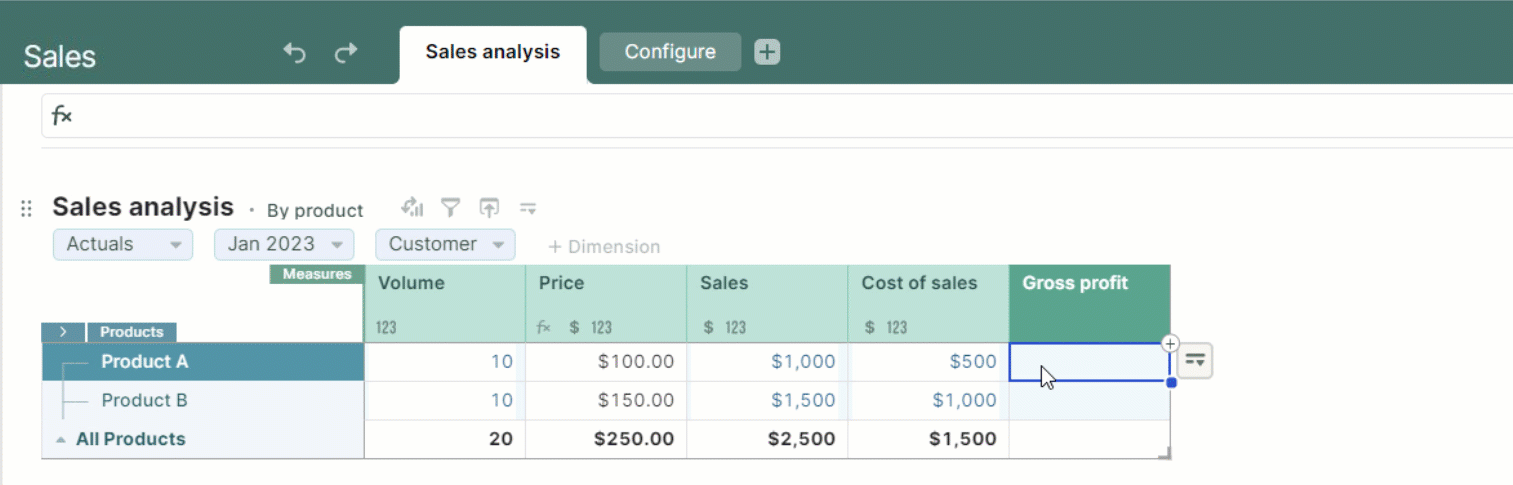
Hive itself isn’t naturally geared towards letting you calculate complex metrics like Pipeline Coverage. As an alternative, teams typically use products like Arithmix to import data from Hive and build out dashboards.
What is Arithmix?
Arithmix is the next generation spreadsheet - a collaborative, web-based platform for working with numbers that’s powerful yet easy to use. With Arithmix you can import data from systems like Hive, combine it with data from other systems, and create calculations like Pipeline Coverage.
In Arithmix, data is organized into Tables and referenced by name, not by cell location like a spreadsheet, simplifying calculation creation. Data and calculations can be shared with others and re-used like building blocks, vastly streamlining analysis, model building, and reporting in a highly scalable and easy to maintain platform. Data can be edited, categorized (by dimensions) and freely pivoted. Calculations are automatically copied across a dimension - eliminating copy and paste of formulas.
Arithmix is fully collaborative, giving your entire team access to your numbers and the ability to work together seamlessly.
Calculating Pipeline Coverage in Arithmix
Calculating metrics like Pipeline Coverage is simple in Arithmix. Once you've created your free account, you’ll be able to import your Hive data, and use it to create natural language formulas for metrics like Pipeline Coverage.
Arithmix is designed to give you the power to build any calculations you want on top of your Hive data, while also being easy to use and collaborate on. You can share your dashboards with users inside and outside of your organisation, making it easy to empower your whole team.
Use Arithmix free