Unlocking the Power of Multi-Dimensional Solutions for Data Analysis


The Limitations of Spreadsheets for Data-Driven Decision Making
As the saying goes, "the data doesn't lie"... or does it? With the rise of data-driven decision-making, managers, data modelers, and analysts are always on the lookout for fast, accessible, and easy-to-use solutions. But if you're relying solely on spreadsheets to model your data, you might not be seeing the full picture.
Sure, spreadsheets are a ubiquitous tool in business, and for good reason. They're powerful, easy to use, and allow users to perform complex calculations and analysis. But when it comes to making important business decisions, spreadsheets may not be the best tool for the job. After all, they're limited by their two-dimensional nature (rows and columns--just two dimensions) and can't easily model complex relationships and interactions.
That's where multidimensional modeling software comes in.
By allowing users to view and analyze data from multiple perspectives and consider various outcomes, these tools can help users make more informed and accurate decisions.
To be clear, spreadsheets are unlikely to be replaced anytime soon. But new software solutions, such as Arithmix, are being developed that build on the power and features of spreadsheets. As AI Summary put it, "Builders are creating new software that doesn’t unbundle Excel, but is Inspired by Excel." As Jenny Bryan, a software engineer and associate professor, puts it: "It seems like everyone wants to make a contribution [in machine learning]. I’m like, you go for it -- I’m going to be over there getting data out of Excel spreadsheets."
While spreadsheets will always have a place in the business world, it's important to consider all of the available tools and technologies when working with data.
Beyond Spreadsheets: The Power of Multi-Dimensional Modeling for Deeper Data Insights
With the power to "slice and dice" data from multiple viewpoints, multi-dimensional modeling enables you to deliver deeper insights into your data. While spreadsheets can only view and analyze data by rows and columns, multi-dimensional models can go far beyond that, providing a more nuanced understanding of your data.
For example, let's say you want to answer the following question:
What products are sold in the North sales territory by customer, by transaction, and by quarter?
You want to analyze what products are sold in the North sales territory by customer, by transaction, by quarter. You want to see the data from multiple viewpoints, so this is a complex question that requires a multi-dimensional approach. A two-dimensional spreadsheet could only give you something like products by territory. That's too high-level to provide the insight you need. By analyzing your data using multiple dimensions, you can gain a deeper understanding of the relationships and interactions within your data.
Don't limit yourself to two-dimensional data views. With multi-dimensional modeling software, you can explore your data in new and exciting ways, and gain insights that were previously impossible. So why not take your data modeling to the next dimension?
What are Cubes in Multi-Dimensional Modeling?
If you're new to multi-dimensional modeling, you may have never heard of cubes before. But don't worry, it's simpler than it sounds. In fact, cubes are a lot like multi-dimensional spreadsheets.
In multi-dimensional modeling, data is stored in a cube, which is constructed with dimensions, hierarchies, and measures. Think of dimensions as the characteristics that you track to run your business. In our example, the dimensions are Product, Customer (the master Customer), Transaction, Territory, and Time (and Version where Actuals and/or Plans are versions). Each dimension contains measures like text, dates, and numbers related to the dimension. For example, for the Customer dimension, you might have data like Customer Name (depending on how you group customers with multiple buying locations), Location, Volume, Price, and Sales.
Hierarchies organize and store the data so that it can be aggregated at various levels. For instance, the Territory dimension can consolidate from a geographical region up into State, Country, and Total.
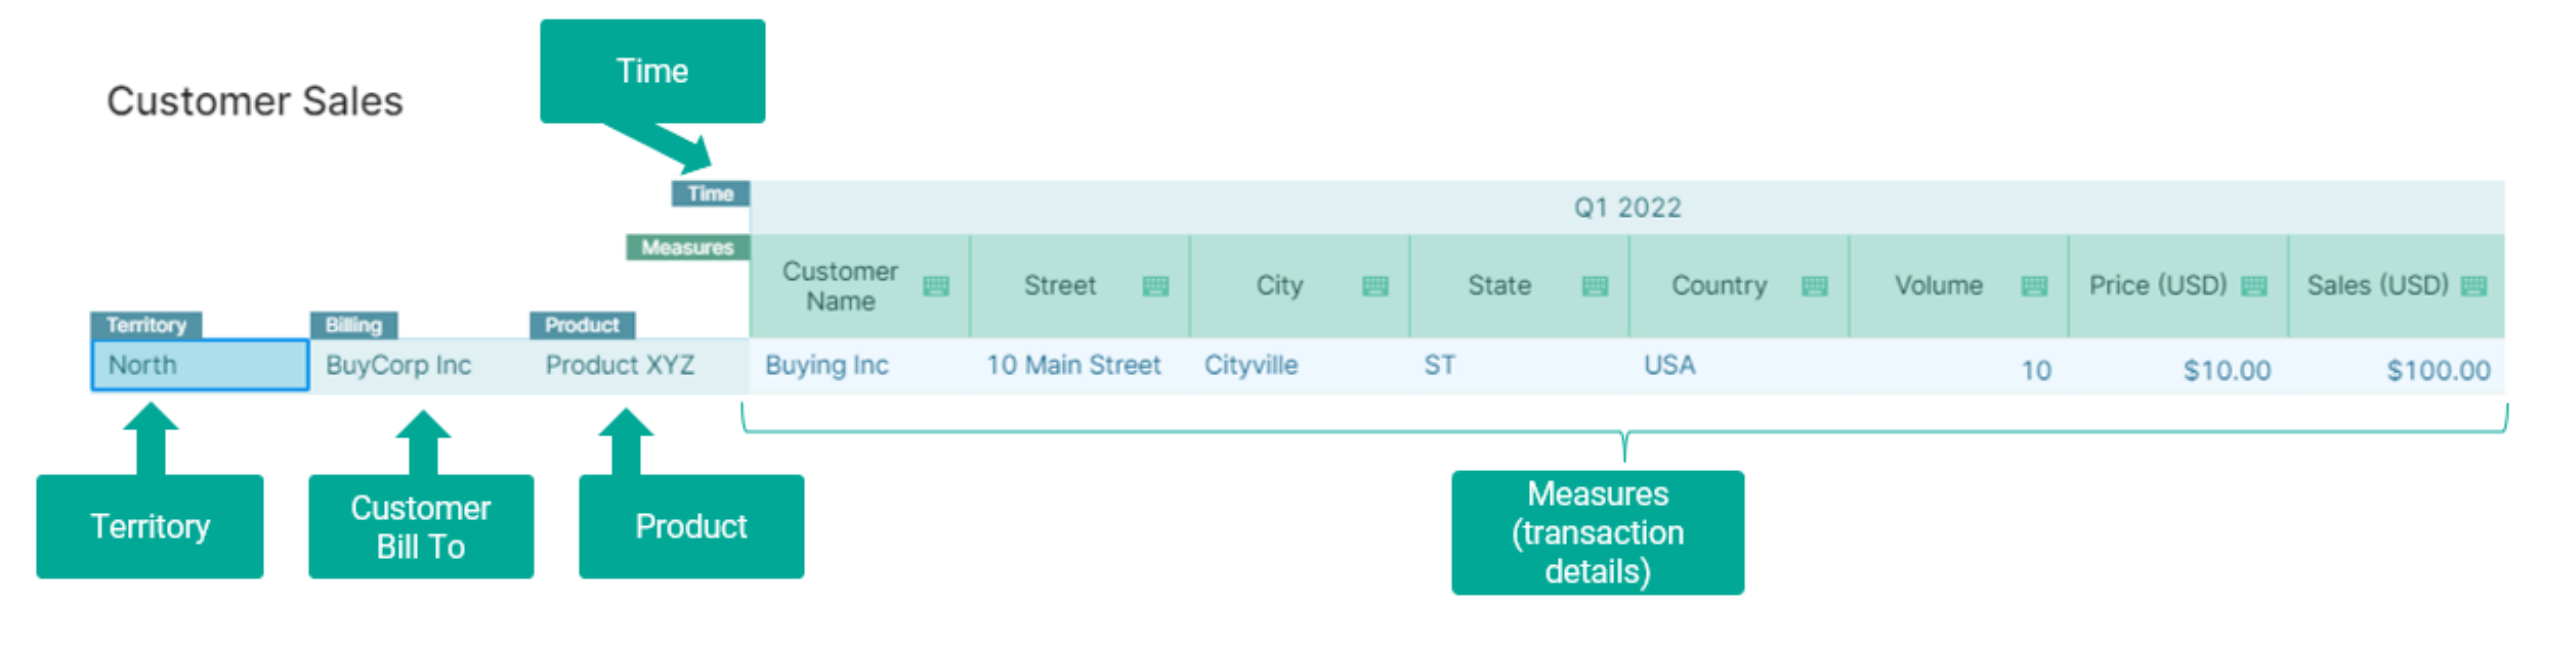
Now, let's revisit our earlier question: "What products are sold in the North sales territory by customer, by transaction, by quarter?" This question is complex and not so easy to answer from data stored in spreadsheets. But using multi-dimensional modeling, we can create a cube that we'll call Customer Sales. This cube will store and organize the data in measures and hierarchies, allowing for detailed modeling and analysis at every level of aggregation.
Take a look at the example cube below, built on the Arithmix platform, a multi-dimensional software solution. With the combination of the dimensions we discussed earlier, you can answer the more complex question we introduced above. Each of the dimensions can be pivoted or combined in different ways, giving you the power to view the data from various perspectives.
So, if you're looking for a more powerful and efficient way to work with your data, consider using multi-dimensional software and cubes to help you uncover insights and make better decisions.
Unleashing the power of cubes
"But it's just a pivot-table?!" you might say. Well, yes, cubes are similar to pivot tables. However, pivot tables have some classic weaknesses, such as difficulties in keeping the data fresh, limitations in sharing with other users, and problems with large data volumes and sparsity. Adding new dimensions and measures may even require a rebuild of the pivot table.
Despite their usefulness, pivot tables share the limitations of spreadsheet lag. If you already appreciate multi-dimensionality, you should consider investigating a pure multi-dimensional solution for better results.
This is where cubes really shine. They allow you to perform additional value-add calculations, such as projecting out future potential performance and calculating averages, trends, and cohorts. With multi-dimensional calculations, trends are immediately applied across the dimensions of Territory, Customer, Product, and each measure. You can easily insert a Version dimension with a simple right-click to allow for modeling and comparisons that inform decision making.
Using cubes and multi-dimensionality is not just a more powerful way to organize and analyze data, but to perform value-add modeling that can give your business a significant competitive advantage.
About Arithmix
Arithmix is creating the first self-service multi-dimensional planning and analysis platform for builders to create, manage and expand their planning apps, then easily and securely share with teams to run their numbers.